Seasonal influenza is rising earlier than usual in the United States, with the Centers for Disease Control and Prevention (CDC) reporting that the flu hospitalization rate for the week ending October 17 was the highest for that week since the 2010-2011 season. National activity is still low, the agency said in its FluView report for week 41, published October 23, but several indicators have been climbing since late August and early September, and early-season activity is higher than usual for this time of year.
According to the report, 5.7% of specimens tested at clinical laboratories were positive for influenza in week 41 (2,918 of 51,490), and 5.1% cumulatively since October 4. Outpatient visits for influenza-like illness stood at 2.2%, below the national baseline of 2.9%, and 0.9% of emergency department visits carried a flu diagnosis, both stable on the previous week.
Hospital data are moving faster. CDC’s FluSurv-NET network recorded 798 laboratory-confirmed influenza hospitalizations between October 4 and 17. The week 41 rate was 1.1 per 100,000 people, which the agency expects to rise to between 1.5 and 2.0 once reporting delays are accounted for, and which it called “the highest weekly rate for Week 41 since the 2010-2011 season.” Hospitals reporting to the National Healthcare Safety Network logged 4,811 confirmed influenza admissions, a rate of 1.4 per 100,000, stable but trending upward. Influenza accounted for 0.2% of deaths in the week, and no pediatric flu deaths have been reported for the 2026-2027 season.
Nearly all circulating virus is A(H1N1)pdm09. Of 241 influenza A viruses subtyped during the week, 239 (99.2%) were H1N1 and none were H3N2; since week 21, H1N1 has made up 81.5% of subtyped influenza A viruses, most of them in the D.3.1.1 subclade of the hemagglutinin gene. CDC said it is “too early to know what viruses may predominate” over the season or whether vaccine effectiveness will be affected.
The same report records one new human infection with avian influenza A(H5N1) in a worker at a Washington State commercial dairy farm where the virus had been found in cows; the worker developed eye irritation and upper respiratory symptoms. CDC repeated that “to date, human-to-human transmission of influenza A(H5) virus has not been identified in the United States.”
The vaccine this season
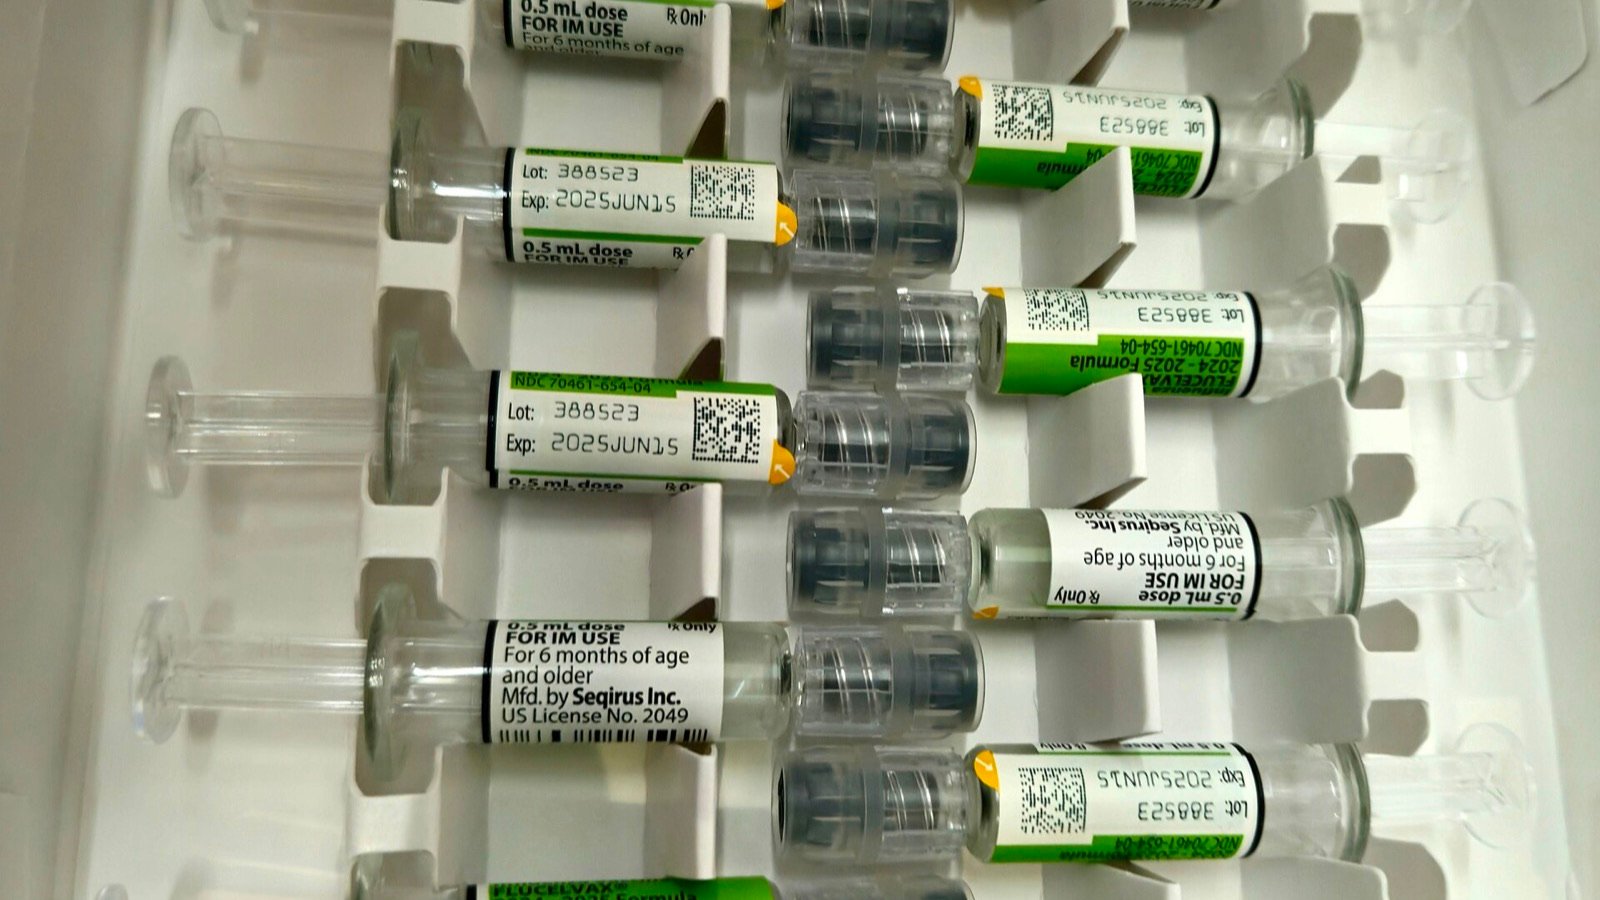
All three components of the 2026-2027 US flu vaccines were changed from last season, according to CDC’s season page, updated September 29, including a new H3N2 component chosen to protect against the subclade K virus that spread widely in 2025-2026. Egg-based vaccines contain A/Missouri/11/2025 (H1N1)pdm09-like, A/Darwin/1454/2025 (H3N2)-like and B/Tokyo/EIS13-175/2025 (B/Victoria lineage)-like viruses; cell-based and recombinant vaccines use A/Darwin/1415/2025 and B/Pennsylvania/14/2025 for the H3N2 and B components. Manufacturers project as many as 135 million doses for the US market, all of them trivalent, 27% not egg-based and 99% free of thimerosal preservative. CDC recommends annual vaccination for everyone aged six months and older, ideally in September or October.
In Europe the picture is quieter. The European Centre for Disease Prevention and Control’s (ECDC) weekly threats report covering week 41 put influenza activity at baseline, with median test positivity of 3.4% in primary care and 4% in hospitals, SARS-CoV-2 at 4.3% and 5%, and RSV activity “very low”; most influenza detections were type A, and consultation rates were rising in many countries, as expected at this time of year.
Why it matters
An early start does not predict a severe season, but it shortens the window in which vaccination can get ahead of circulation, which is why CDC’s guidance points to September and October. The current vaccine’s H1N1 component was updated for this season to an A/Missouri/11/2025-like virus, and CDC has not yet published effectiveness estimates against the D.3.1.1 viruses now dominating.
For hospitals, the FluSurv-NET signal is the one to watch. A week 41 rate that already exceeds every comparable week since 2010-2011 is an early-season warning, and CDC’s own note that the figure will likely be revised upward means the true rate is probably higher than the 1.1 per 100,000 first reported. The ECDC figures show Europe has not yet seen the same rise.
The caveats
All FluView data are preliminary and subject to reporting delays; the hospitalization rate in particular is expected to be revised. Low testing volumes early in the season mean small numbers can move percentages. CDC’s report gives no vaccination coverage figures for the current season, and the 135 million-dose figure is a manufacturer projection of production, not a count of doses distributed or administered.
This article is for general information and does not replace advice from a qualified clinician. Corrections: email the editor using the address on the Contact page.